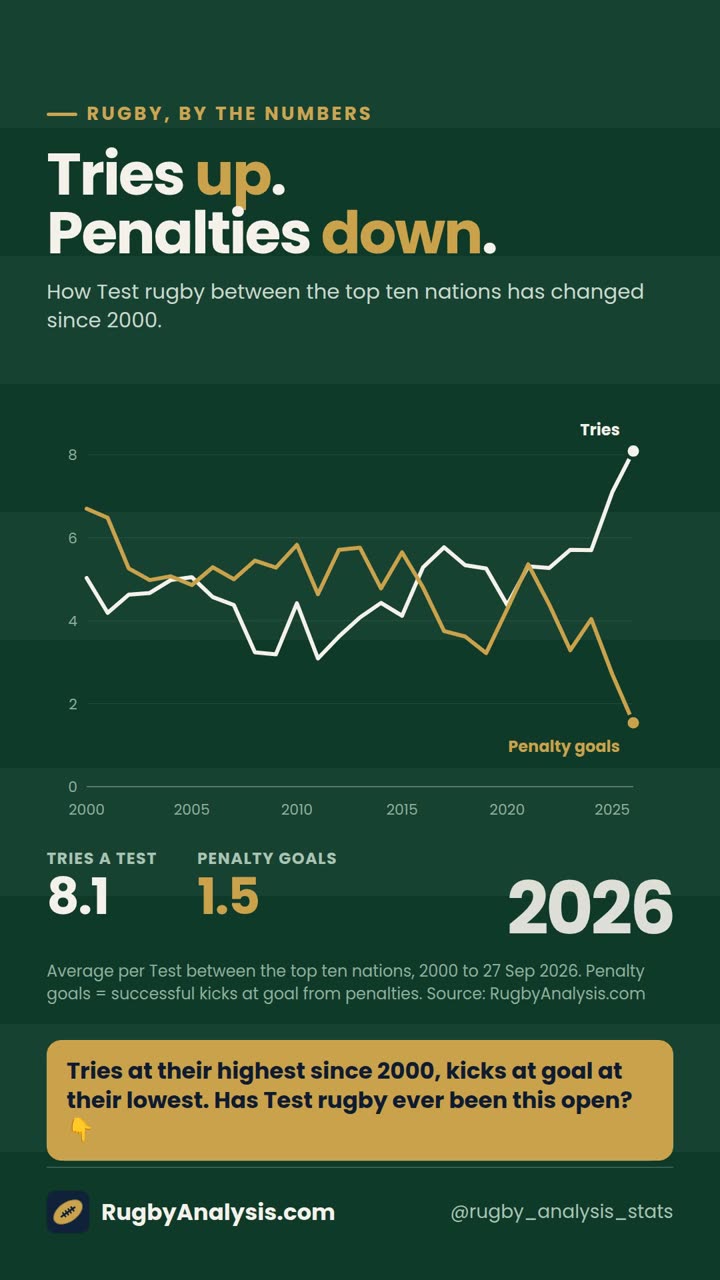
Tries up, penalties down
Top-ten Tests in 2026 average 8.1 tries and just 1.5 penalty goals.
Rugby union is one of the world's great team sports. Here's the two-minute version, and where this site fits in.
Two teams of 15 play for 80 minutes. You can run or kick the ball forward, but you may only pass it backwards or sideways.
Ground the ball over the line for a try (5 points) and kick the conversion (2). Penalties and drop goals are worth 3. When a player is tackled, both sides fight for the ball on the ground, so play keeps flowing.
Rugby league has 13 players, hands the ball over after six tackles, and a try is worth 4. American football allows forward passes, blocking and helmets, and stops after every play.
Sevens is the same game with 7 a side and 14-minute matches, and it's the version played at the Olympics.
The strongest nations are New Zealand, South Africa, Ireland, France, England, Australia, Scotland, Argentina, Wales and Italy. Fiji, Samoa, Tonga, Japan and Georgia are rising.
The big events are the Six Nations in Europe (Feb–Mar), the Rugby Championship in the south (Aug–Oct) and the Rugby World Cup every four years. The next one is in Australia in 2027.
A match between two nations is called a Test. We hold every result back to the first one, Scotland v England in 1871, plus rankings, head-to-heads, trophies and player stats.
Start with the 60-second videos below, then pick a team from the menu to dig in.
Next big Test: Ireland v Argentina (Nations Championship · Round 4), Fri 6 Nov. Then: the Nations Championship finals at Twickenham (27–29 Nov) and the 2027 Rugby World Cup in Australia. All fixtures →
Short videos on the stories hiding in the numbers. Tap to play.
Top-ten Tests in 2026 average 8.1 tries and just 1.5 penalty goals.
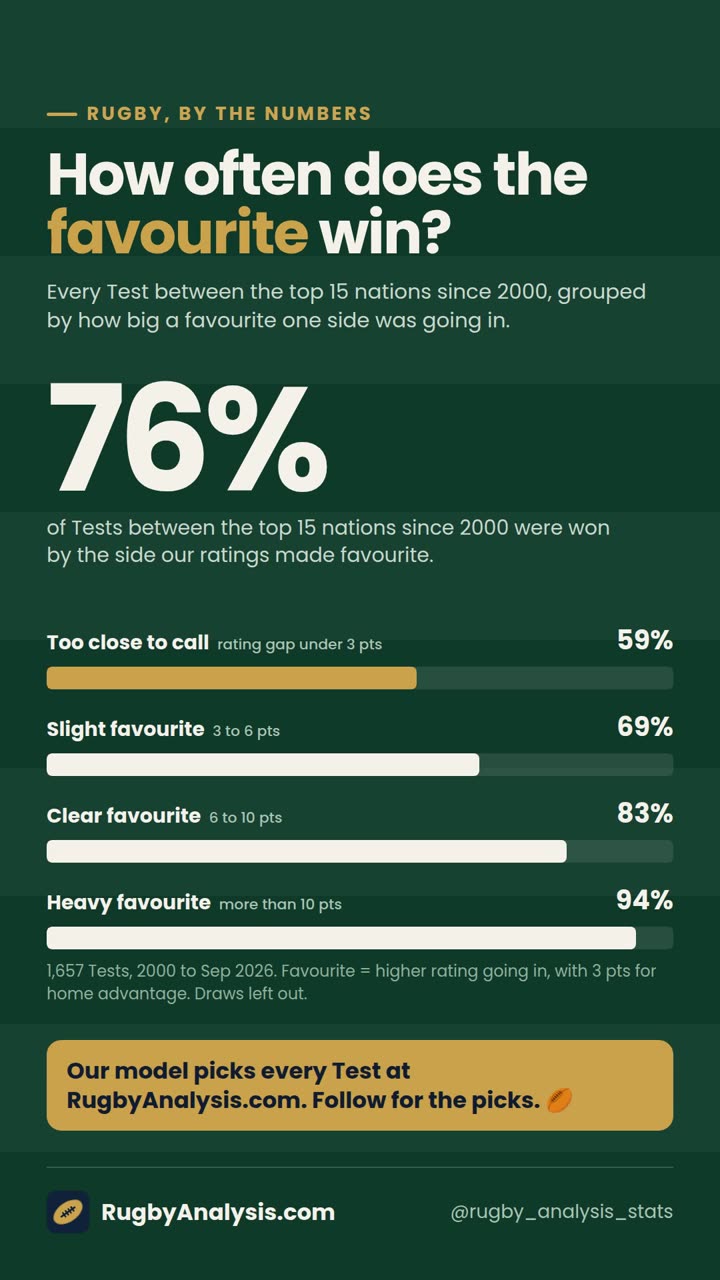
76% of the time since 2000. When it is too close to call, only 59%.
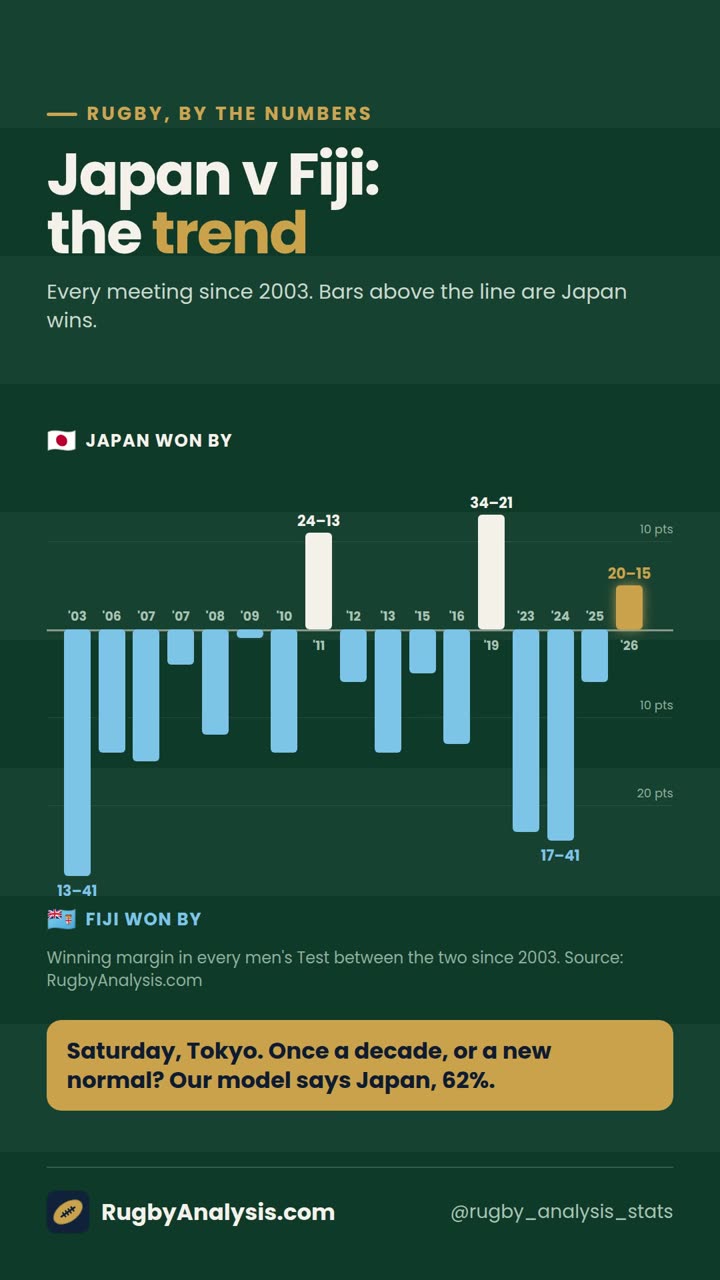
Fiji won 11 of the first 12 meetings since 2003. Japan have won 2 of the last 5.
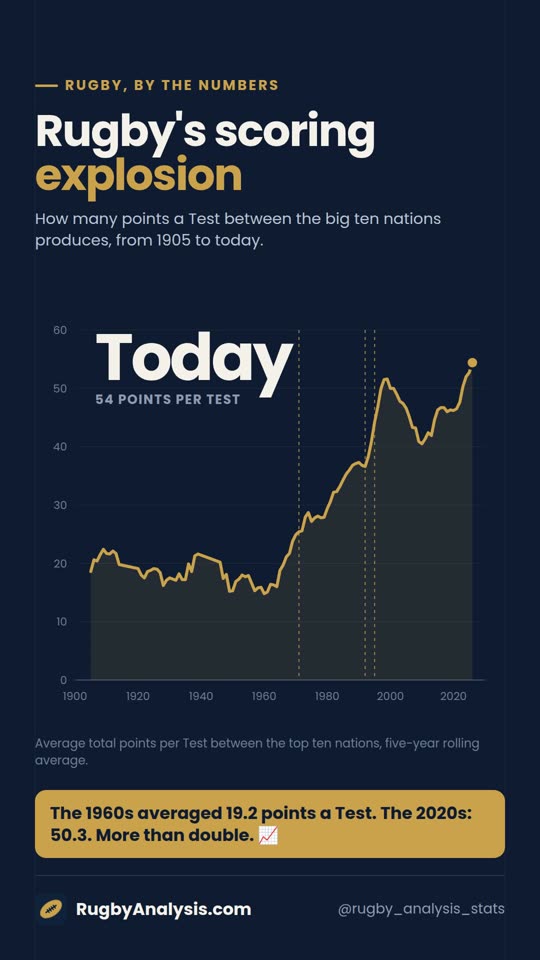
Top-ten Tests averaged 19 points in the 1960s. In the 2020s it's 50.
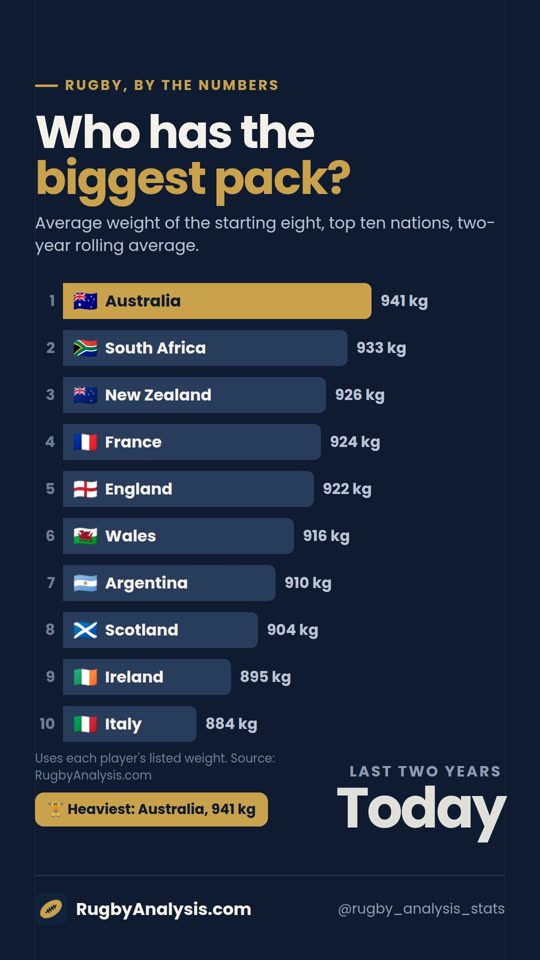
Twenty years of starting eights by weight, with the top three trading places.
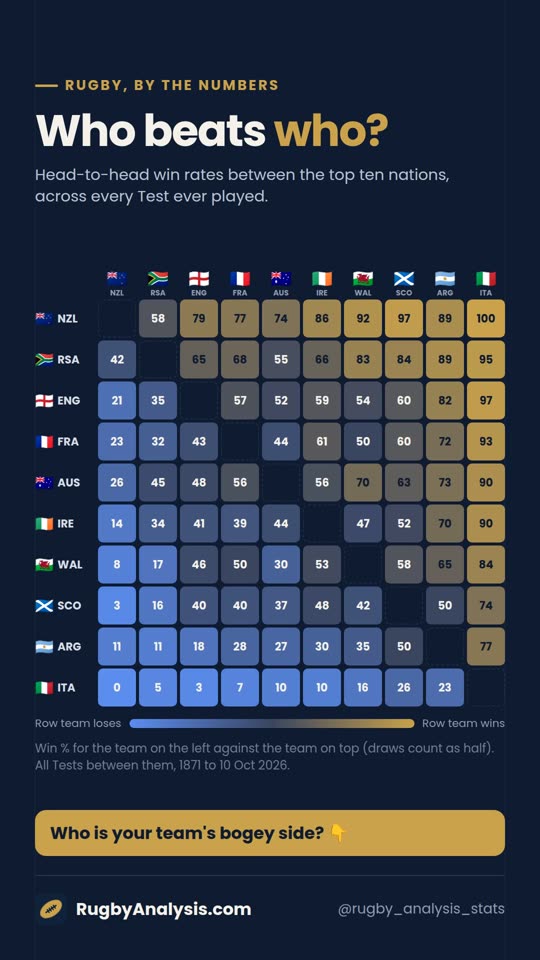
Scotland have played New Zealand 33 times and never won. Wales v France is dead level.
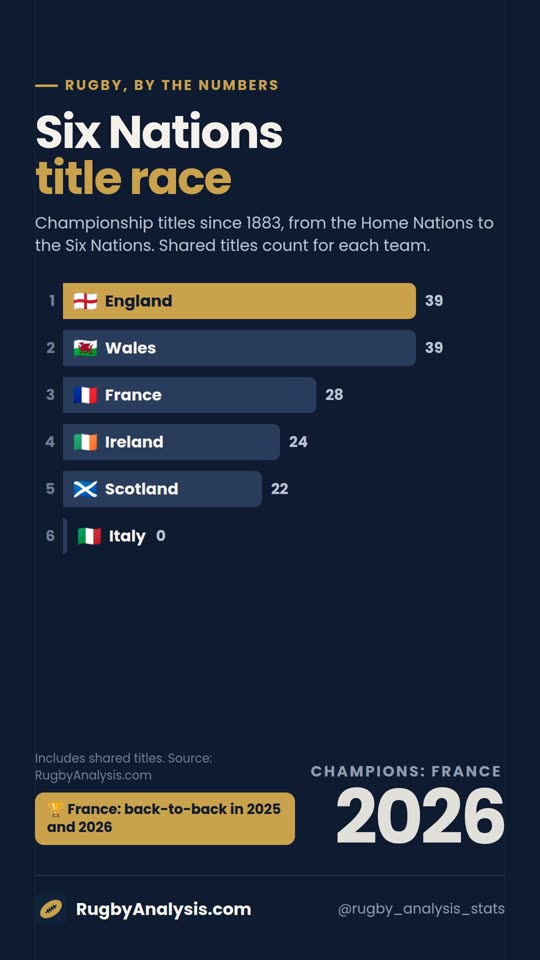
143 years in 60 seconds. England and Wales are level on 39 titles each.
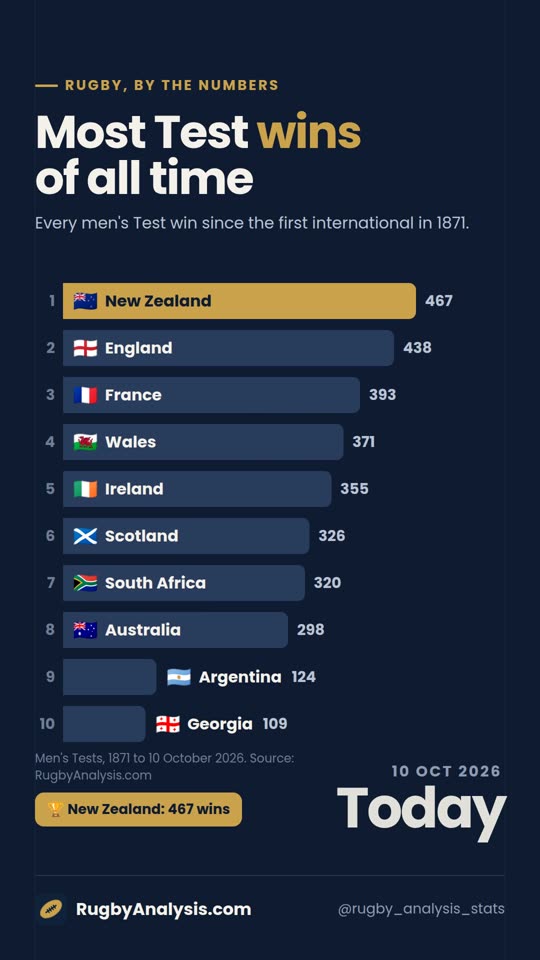
England led for decades. New Zealand moved ahead for good in 2012.
Every Test between the two sides in the dataset. The era buttons above narrow the window.
These two sides have not met in this window.
Results in each decade
Record by host nation, then the longest winning runs
Winning margin of each Test, oldest to newest. Hover a bar for the score.
Landmark results in the fixture
Tries in this fixture, from Tests with try-scorer records
Players named in the 23 most often for this fixture, from the line-ups we hold
Newest first. Click a result for the scoring, cards, match stats and line-ups where we have them.
Kick-off times are shown in your own time zone. Model picks come from the same team ratings used for the Nations Championship forecast (recent results, home advantage and head-to-head history).
All six play-offs are at Allianz Stadium, Twickenham. Each Northern team plays the Southern team that finished in the same position. Projected teams are the most likely finisher in each slot from 40,000 simulations of the remaining group games.
World and continental championships
Champions each year. Hover or tap a flag for the detail; a dot marks a Grand Slam.
Trophies contested between two nations. The holder is the winner of the most recent Test in which the trophy was at stake (a draw leaves it with the holder); World Cup matches are excluded, and trophies tied to the Six Nations only count Championship matches. Records cover those Tests since each trophy was first contested.
Average per Test, both teams combined, by year. Uses Tests with detailed match reports; card trends start in 2010, when line-up card records become reliable enough to compare.
Per Test, for the selected era and opponents. Click a column heading to sort, or a team to open its page.
Team stats from ESPN match centres: Six Nations, Rugby Championship (and Tri Nations), Rugby World Cup and Women's Rugby World Cup. Summer and autumn Tests are not covered. Kicking metres and scrum penalties are not published in this feed.
Standout records for the selected era
The most recent Tests
Average combined points per Test by decade. A try was worth 2 points until 1893 and 4 until 1992; it is 5 today.
Pick a factor and see how it lines up with each nation's results in all Tests since 1 January 2021. Hover a flag for details; click it to open that team.
Every player with 100 or more Test caps, from Wikipedia. Lions caps count towards the total.
Per-game records need at least 15 games with player stats.
Click a column to sort and a player to open their profile. "Tests held" counts the line-ups we have, so it is lower than official caps for most players. Per-game figures need five games with player stats.
Line-ups, player profiles and per-match player stats from ESPN match centres; official caps and current squads from Wikipedia. Weights and heights are the player's listed profile figures.
Share of Tests won, drawn and lost in each decade
Average points per Test, scored vs conceded
Win rate each calendar year. Darker = more wins. Hover a year for the detail.
Record against each opponent, most-played first. Click a row to filter the results list.
Last 10 Tests, oldest to newest
Home, away and neutral-venue record
Team match stats (tackles, line breaks, set piece) are available for Six Nations, Rugby Championship and World Cup Tests from about 2009. This team has none in the selected era.
No current squad list for this nation yet.
Tests in the selected era from the line-ups we hold. Click a player for their profile.
Records within the selected era
Most recent first
Tap a result for tries, kicking, cards, referee and attendance.